Adel Growth and Financial Impact
These are my remarks during the public hearing at the Adel City Council meeting on Tuesday, October 10, 2017. It covers population trends, modifications to the abatement program, the very positive financial impact to the city and other facts that put the abatement and Adel’s growth in perspective.
If you are new to town, or even a long time resident, the population information may surprise you.
Adel Population – Abatement – Revenue – Other Facts
As you read about this 2010 – 2017 time period, keep these numbers in mind:
- $900,000
- $542,000
- $200,000
- $493,000
- Minus $1,394,736
- 12 years
Population Trends
In 1990 Adel’s population was 3,304. Between 1950 and 1990 Adel had grown by 1,505 residents. There was a consistent 16% or better decade over decade growth averaging 376 new residents per decade. Between 1980 and 1990 Adel’s pace of growth exceeded the cities of DeSoto, Van Meter, Waukee, Dallas Center and Perry. Clive, Urbandale and West Des Moines had not yet made their way to Dallas County in any significant form.
During the decade of the 90s the country was in fairly good shape. We enjoyed the fruits of the peace dividend with the end of the cold war and the country had a balanced budget for the first time since 1969. Times were good.
However, the census from the year 2000 showed Adel only grew 131 people, a 4% growth rate. From 1890 through 2000, of the eleven Adel censuses there was only one decade where growth was at a slower rate and that was during WWII in the 1940’s. Adel grew at a faster rate during the Great Depression of the 1930s. Even during the farm crisis of the 1980s, Adel grew at a rate four times faster than the 1990s.
For those who say we should let growth come naturally / organically, that was the approach the city took in 2000. Highway 6 (Hickman Road) between Waukee and Adel was widened to four lanes during the latter part of the 1990s so starting in 2000 it would be easy for folks to discover Adel and the town would grow again like it did between the 50s and 80s.
So between 2000 and 2010 with the new four-lane highway opening and Dallas County beginning to brag about being the 10th fastest growing county in the country based on the rate of population increase, Adel picked up the pace of growth right? This was not the case.
At a 16% growth rate we should have added 550 new citizens. The census show less than half that. The 7.2% growth (2000-2010) over the last 120 years (12 censuses) exceed only slower growth during WWII, The Great Depression, the 1990s, and by .9% beat the 1900-1910 decade.
An item of note about Adel’s growth from 2000 – 2010 was ADM’s student enrollment. It was flat and at times declining. This evidenced by the “Population by Age” detail in Adel’s 2010 census profile showing persons ages 5 to 17 declined by 25, from 744 to 719.
From 1980 – 1990 Adel was the fastest growing town in Dallas County. This was until Dallas County became one of the growing counties in the country.
A closer look at the area’s population trends (Clive, Dallas Center, Perry, Urbandale, Van Meter, West Des Moines, and Waukee) between 1990 and 2010 show that all seven of these communities grew at a faster pace than Adel. Of the 62,310 folks that moved to these communities, 378, or .61% selected Adel.
For two decades, 20 years, natural / organic growth was not doing it. Adel’s potential customers / new citizens were selecting the competition in the surrounding towns.
The city began thinking of Adel as a product to sell. A way to get “customers” to “buy” your product, or at least take a serious look at it, is to lower the price. Once folks select Adel and build a home, they are customers for life. Now the people who built the home may not be here for life, but the owners / occupants will be and they will be paying taxes.
The Abatement Program History
To get peoples’ attention Adel adopted an aggressive abatement program in 2011 where if folks built in 2011 they would not pay property taxes for seven years; built in 2012 no property taxes for five years; and built in 2013 no property taxes for three years. There were ~70 buildable lots in Adel in 2011 and the city issued 26 building permits, four more than 2004, and two years before the national economic downturn.
Realizing we were not getting the bump we wanted in house permits, in March of 2012 the abatement program was changed to make 2012 seven years instead of five years of abated taxes and 2013 five years instead of three years. In 2012 the city issued 27 building permits, one more than the previous year.
During the two year period (2011 & 2012) of no taxes for seven years the city issued 53 building permits, three more than the 50 issued during 2004-2005 period before the economic downturn in 2006.
At the end of 2012 seeing that the adjustment in March to the abatement program didn’t move the needle, the city council extended the “no property taxes for seven years” to construction during 2013, 2014, 2015 and 2016. In 2013 47 building permits were issued and we were finally starting to see some real growth.
However, by June of 2014 the pace of building permits was down (only 41 building permits were issued all of 2014) so the city council extended “no property taxes for seven years” to 2025. It was this action by the city council that really kick started the housing construction. Developers made commitments and created a new inventory of lots to build on.
In 2015 119 building permits were issued and in 2016 138 building permits and in 2017 we are on pace to issue close to 150 building permits.
Growth Impact on Revenue
So what has this growth meant for the city?
Infrastructure and water / sewer fees – The developer / homeowner pays for all water and sewer infrastructure, streets, street lights and public improvements. There is no cost to the existing taxpayers for these improvements. When a homeowner moves in and starts using the city’s water and sewer utilities, he or she immediately starts paying water and sewer fees, as there is no abatement on these fees.
Permit and connection fees – When a home is built in Adel the owner pays on average $1,625 in building permit, water connection and sewer connection fees. The permit fees are placed in the general fund and the connections fees go to the water and sewer utilities respectively. To date the city has collected ~$900,000 in these fees
What have these fees meant to the taxpayers? During the eight years (2005-2012) before the abatement program the total property taxes collected increased an average of 4.67% year over year. The five years (2013-2017) since the abatement property would have impacted the tax rolls, taxes collected increased at a 1.35% increase year over year. Thanks to the fee revenue from abated homeowners the city has been able to save the taxpayers $200,100 since the abatement program began.
This savings is also evidenced by the city’s audited financial statements where during the 2010 – 2011 fiscal year real estate taxes were 50% of the city’s revenue. The 2015-2016 audited financial statements showed the city’s reliance on property taxes had dropped to 37.8%.
Local Option Sales Tax – The local option sales tax revenue has been positively impacted also. The state’s original distribution to the city in 2011 was at a rate of $350,000 annually based on $35 million in sale. At the end of the fiscal year 2017 the city has experienced a 43% increase in sales and has resulted in $542,000 more in local option sales tax than originally projected over a seven year period. To date the city has received $2.8 million in local option sales tax revenue which has gone to pay down the debt on the Aquatic center and build reserves for the purchase of 30 acres of land for future parks and recreation use. These 30 acres along with the 10 acres already purchased will make it Adel’s largest developed community park.
Road Use Tax (RUT) – Population was mentioned earlier and one downside of not growing is its impact on our Road Use Tax (RUT) revenue. The State of Iowa uses the most recent census to distribute its gasoline tax to the cities. These funds are used to maintain city streets. Had Adel grown at the 16% rate during the 1990 – 2010 time periods, like it did the 40 years from 1950 – 1990, at the end of this decade we would have received an additional $1,394,736 in road use tax. Adel lost these funds and will never get them back.
Because of the growth since the abatement, if there was no other growth in Adel between now and 2020, we would still see an additional $733,200 of RUT distributions in the next decade.
Other Facts
Residential assess values – In 2011 the average assessed value of existing homes in Adel was $138,000. According to the assessor the average value for new homes built in Adel since the abatement program was adopted in 2011 is $319,500. Over double the assessed value of existing homes.
From the Dallas County Assessor’s office the 2011 total assessed value of single family properties in Adel prior to the abatement program was $209,774,530. The total assessed value of abated homes built through the end of 2016 equals $119,475,010. A 57% increase on assessed property value in a five year period.
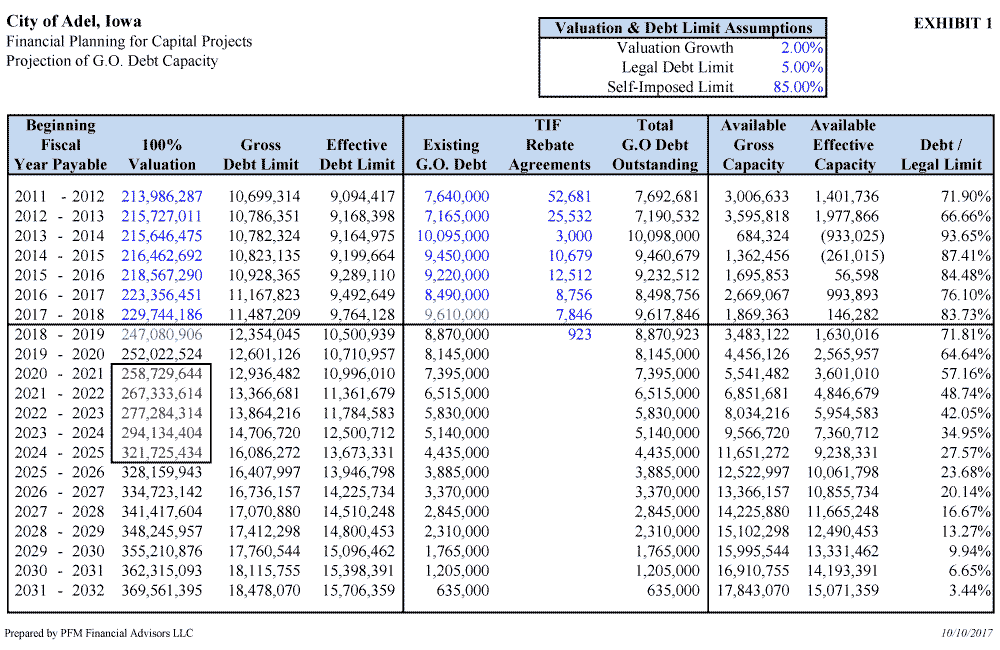
Debt Capacity – Adel’s debt capacity (5% of assessed value) before the abatement was $10,488,726. Once these values pass through the abatement program and appear on the tax rolls, it will add $6,000,000 to the city’s bonding capacity, improving the city’s financial strength.
Reserve balances – For the city’s balance sheet the rule of thumb is to have 25% – 33% of the annual expenses on hand. From the audited financial statements in 2010 – 2011 the city’s unrestricted cash balance was $70,463 or 6% of annual expenses, well short of a safe and sound balance. The latest audited financial statement from 2015 – 2016 the city’s unrestricted cash balance was $563,265 or 28% of annual expenses. Adel’s financial condition from a balance sheet standpoint is as strong as it has been in years.
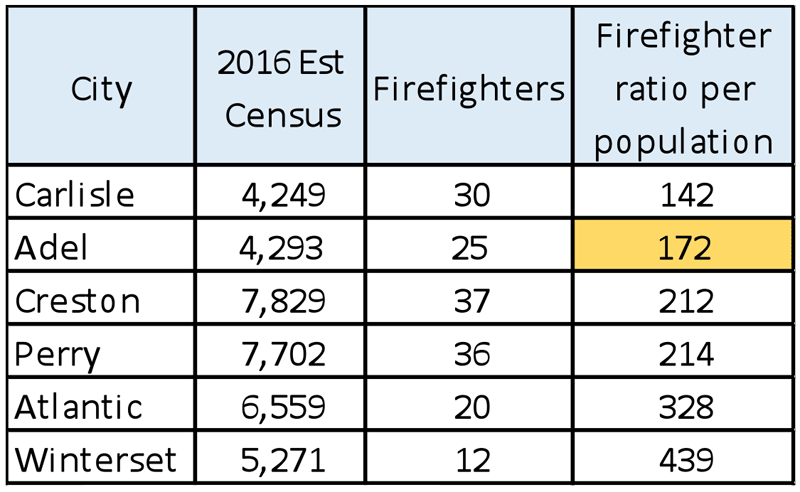
Even with the accelerated growth since 2011 (we have grown 16.6% these first six years), Adel’s estimated population of 4,293 is 153 short of the 4,446 we would have been at the with 16% growth from 2000 – 2010. Carrying the 16% growth rate between 2010 and 2020 our population would have reached 5,113. Again, these population numbers are at the same growth rate Adel experienced over a 40 year period from 1950 – 1990.
If you remember anything from this information, remember this:
- $900,000 in fees from new homes since 2011
- $542,000 in additional local option sales tax revenue attributed to growth in Adel’s economy
- $200,000 in taxes saved to those paying property taxes since the abatement began
- $493,000 increase in cash reserves
The result from the growth is an annual $355,000 positive impact to the city.
To put the abatement and home values in perspective, the $138,000 average Adel home before the abatement would pay $987 annually ($14.30 / $1,000 in value). The average abated home with the value of $319,500 will pay $2,285 annually. In the 5.18 years the abated home pays taxes will equal what the non-abated home will pay over a 12 year period.
Over a 20 year period the average non-abated home will pay $19,740; and abated home over the same period will pay $29,705 or about $10,000 more (including the seven years of not paying taxes.)
All the city did was change its business model by swapping / forgoing property tax revenue for a larger amount of fee and local option sales tax revenue in the beginning with the guarantee of increased real estate tax revenue on the back end from the growth. The city is essentially providing tax relief both on the front end, then on the back end, through increasing revenues, all related to growth.
I have been involved in city government for 30 years and from a growth and financial perspective, Adel has never been better.
Respectfully Submitted,
Jim Peters
925 S. 14th St.
Adel, IA 50003
NOVEMBER 7th IS NOT THE TIME TO TAKE A CHANCE ON INEXPERIENCE.